Your delivery plans shouldn’t live in someone’s head
Float gives Operations leaders a shared, real-time view of people, projects, and profit. Make decisions with clarity from a single source of truth.
Trusted by Operations and resourcing leaders across 4,500+ teams


.svg)


.svg)
You’re taking on more work. But do you know what it actually takes to deliver it?
When capacity, availability, and costs live in disconnected tools (and occasionally in your team’s minds), you’re running on vibes and missing the full picture. Delivery stays reactive, and you commit to work without a clear view of consequences.
Forecasting gets harder as complexity grows
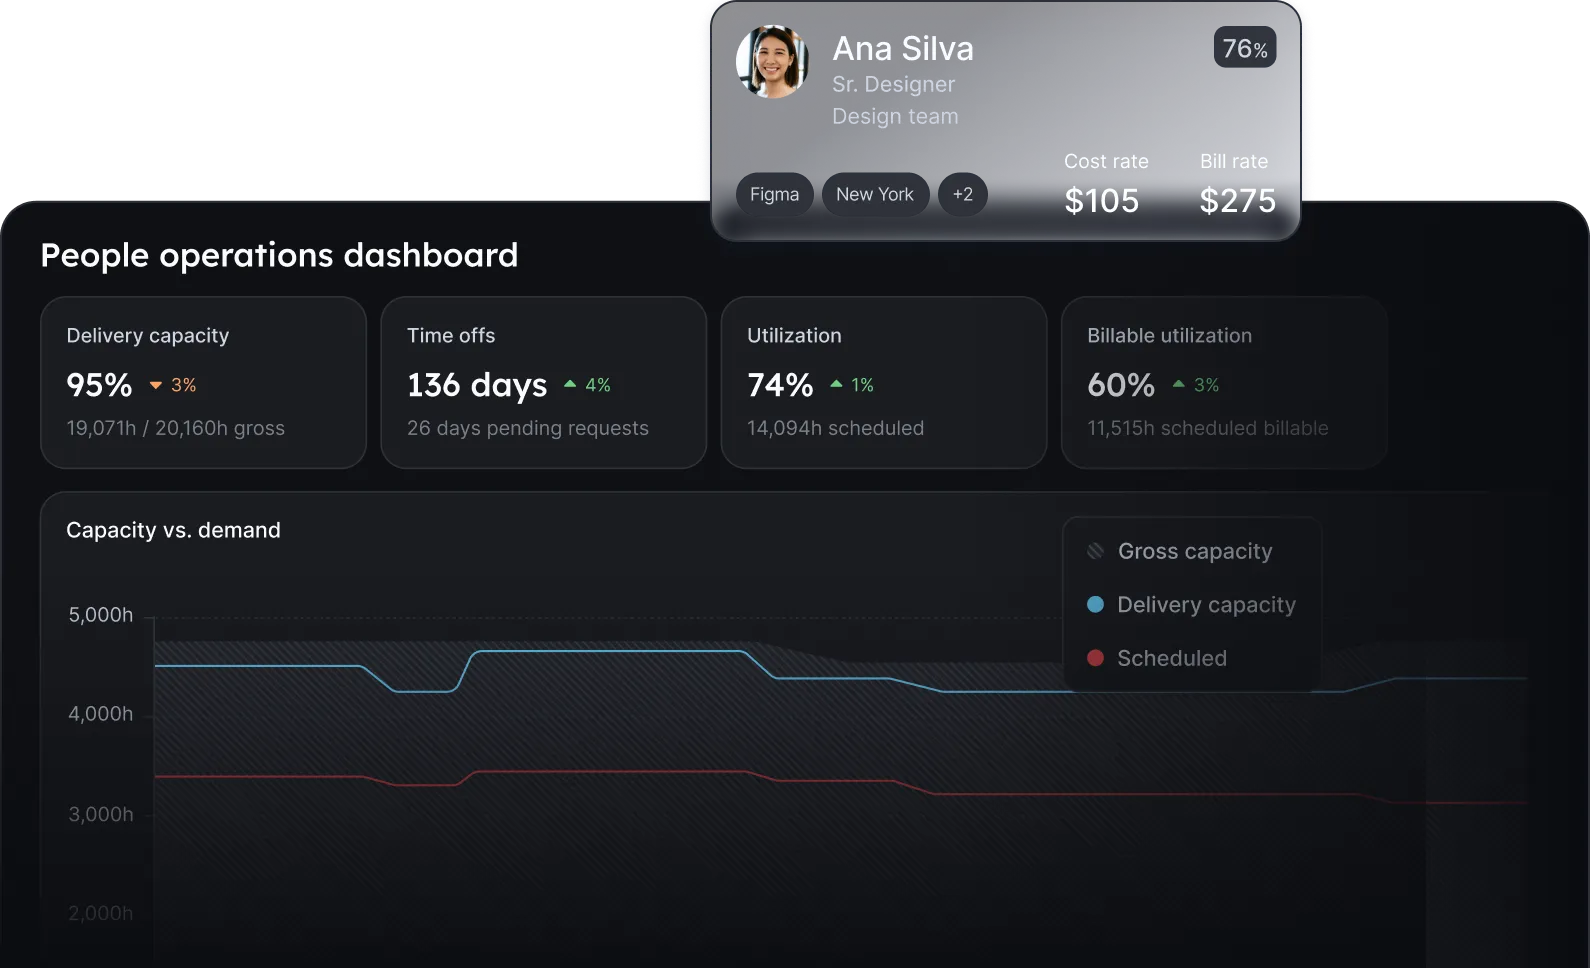
FTEs and contractors work together; your data doesn’t

Margins erode slowly, then all at once
One source for capacity, delivery, and costs
Float is your single source of truth for project performance: make confident decisions knowing your team can deliver.
Plan with full context before you schedule the work
Review different staffing scenarios before kickoff. Compare their impact on utilization, timelines, and margin, then align on a clear baseline before work begins.
Plan across your full talent network
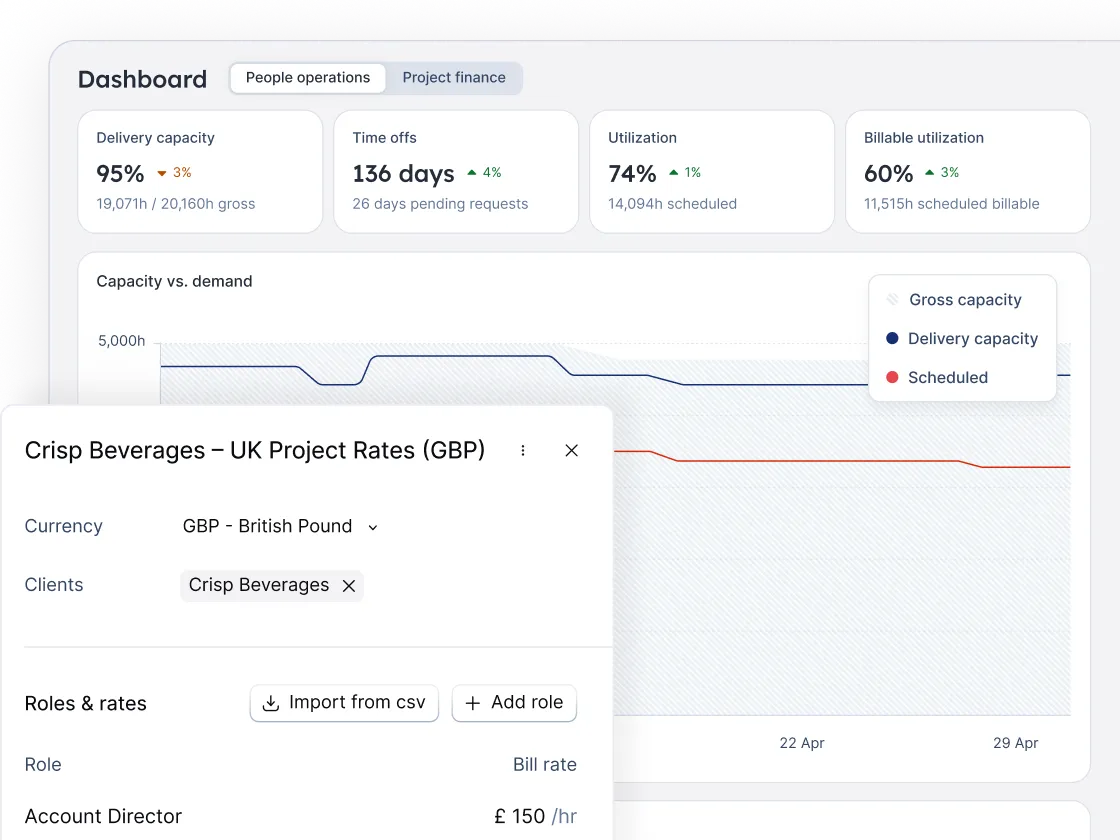
Unify FTE and contractor capacity, utilization, and rates into one connected view, with client-specific rate cards applied consistently across projects and currencies. Every staffing decision is clear, coordinated, and based on the full picture.
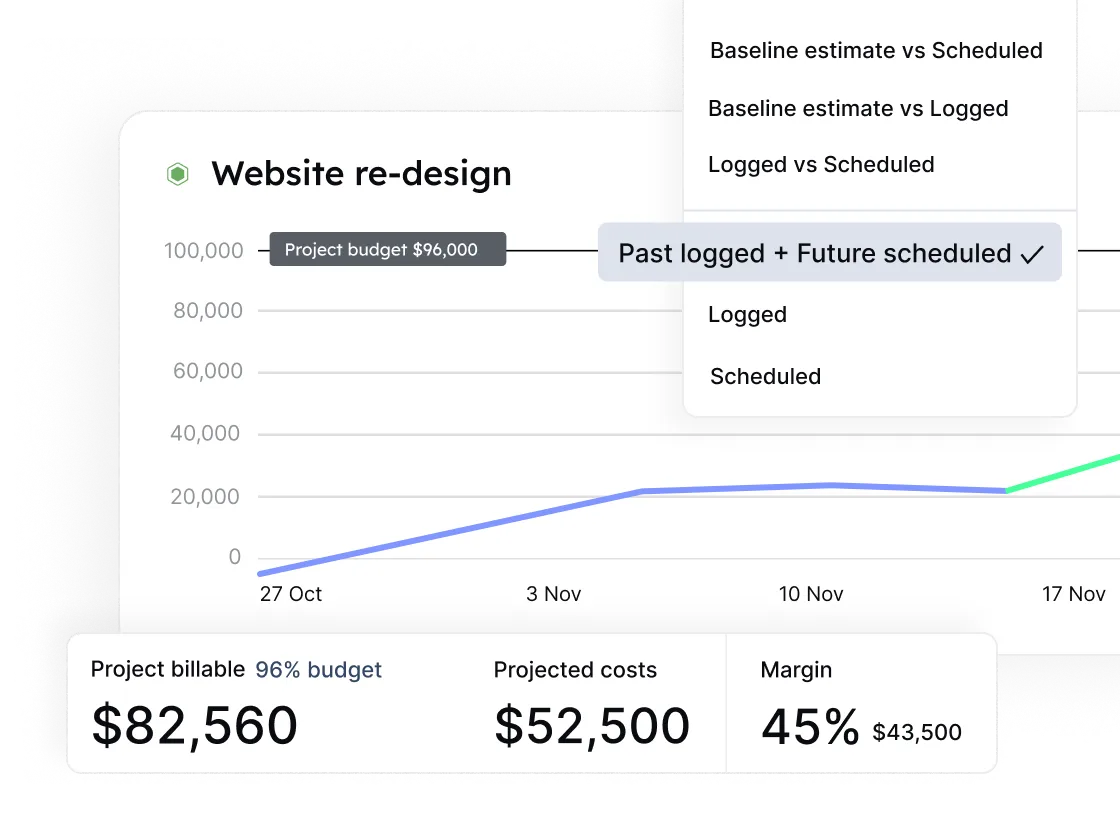
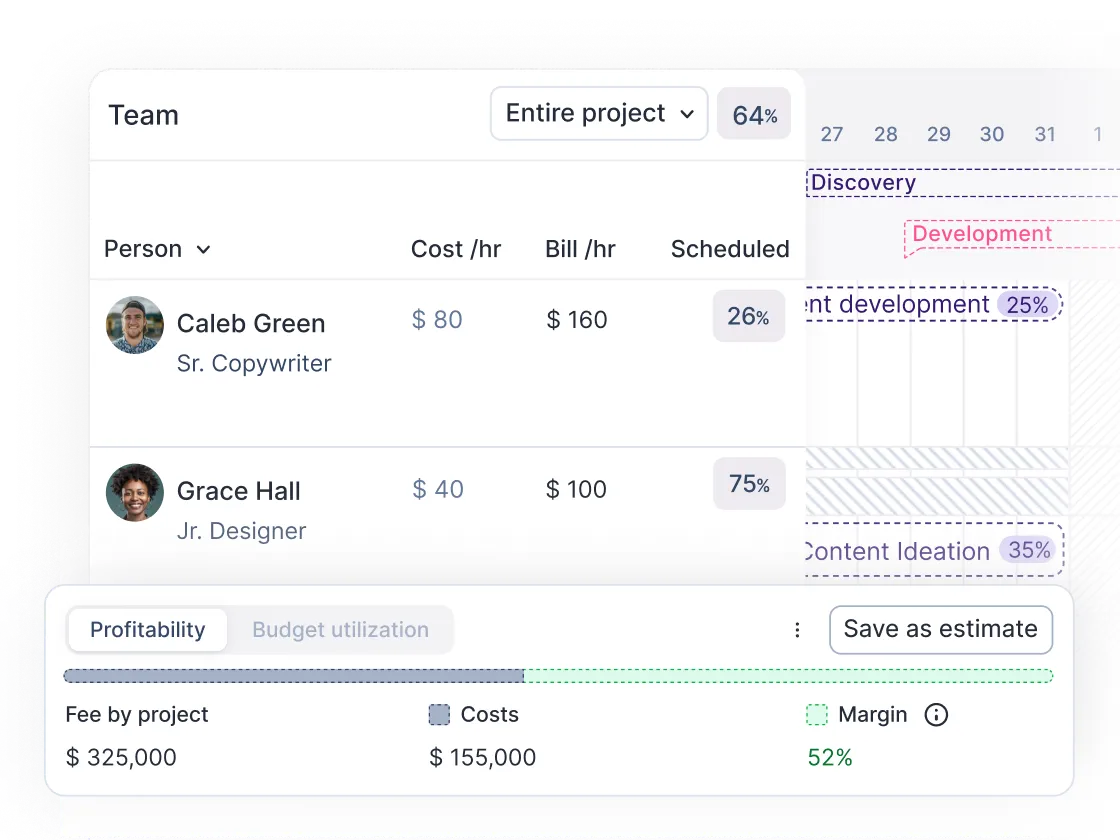
Catch delivery issues early, not at invoice time
Track budgets against actuals in real time. Spot planning gaps and overservicing early, and act before small variances become delivery and margin problems.
Chosen by the best to get resourcing right
See how teams like yours make people-first, profit-minded decisions every day with Float.


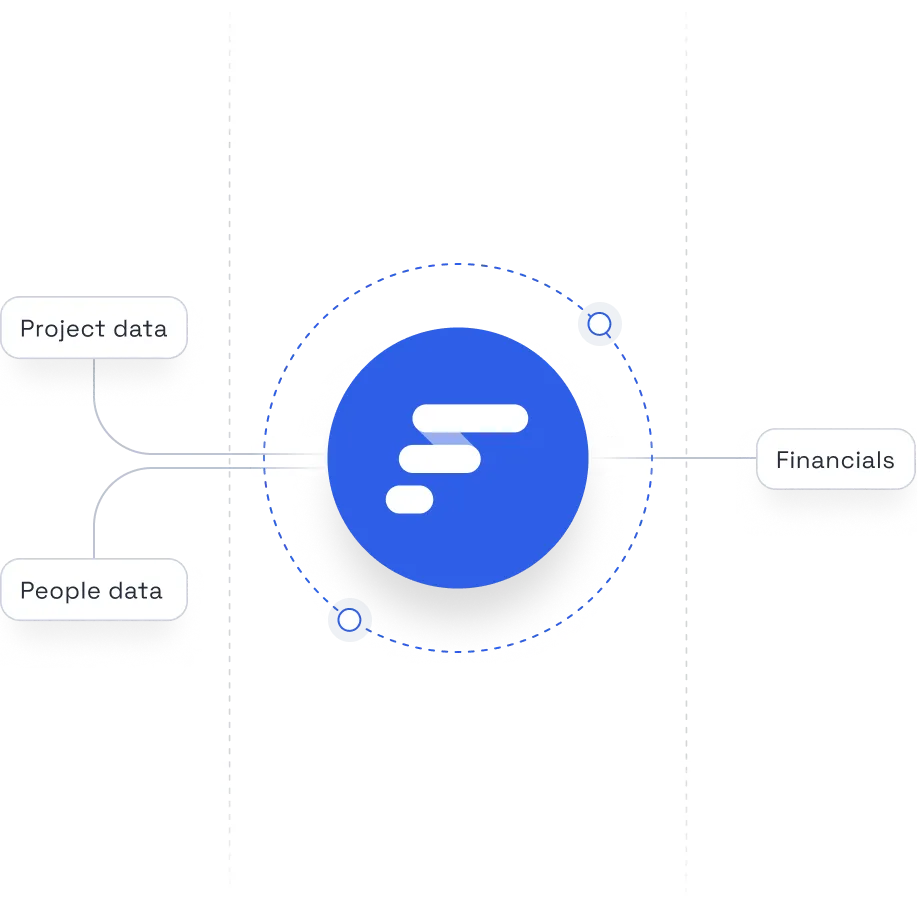
Profitable delivery runs on connected data
Float sits at the center of your people, project, and financial systems, keeping the data at the core of your operations accurate and always up to date.