Finance shouldn’t be the last to know when delivery goes wrong
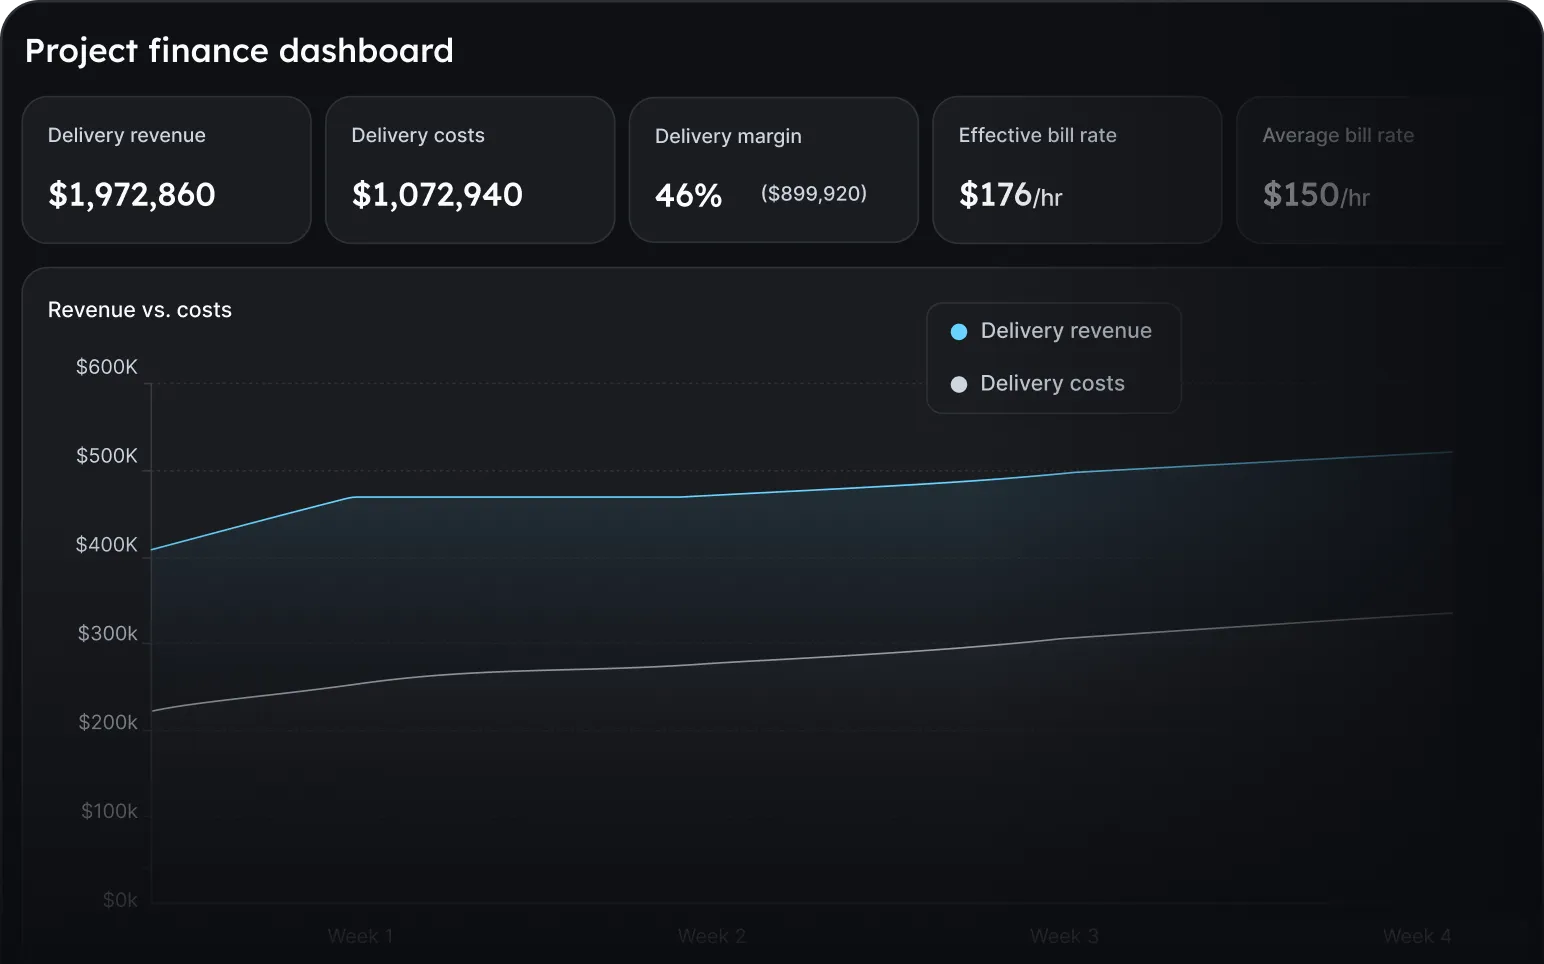
Float captures delivery in real time. It’s the view that sits between pipeline and timesheets, which Finance never had. Until now.
Trusted by Finance leaders across 4,500+ teams




.svg)







.svg)



Delivery happens—and Finance finds out, later.
When you have patchy visibility into the sales, staffing, and delivery decisions that determine your financial outcomes, you cannot influence them in real time, either.

Forecasts built on historical data quickly drift from reality

Margin is shaped well before Finance can influence it

Margin consolidated across currencies loses precision
Project delivery meets financial visibility
Float connects financial data to the delivery decisions that shape it. With a live view of how delivery is running, Finance gets accurate data before each quarter closes.
Forecasts you can stand behind
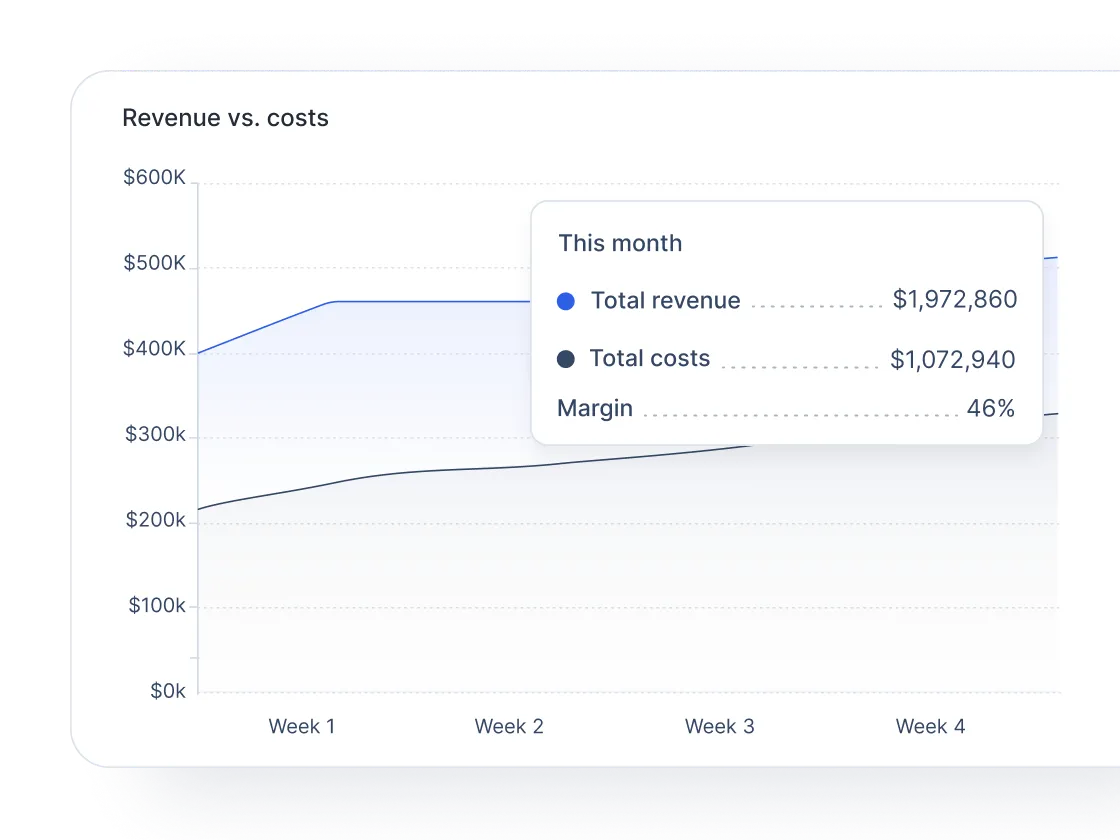
Whenever timelines shift or staffing changes, your projected revenue, delivery costs, and margin update with them—across every client currency, consolidated into your home one. The data reaching Finance reflects what’s currently happening, not what was planned weeks before.
Margin managed in real time
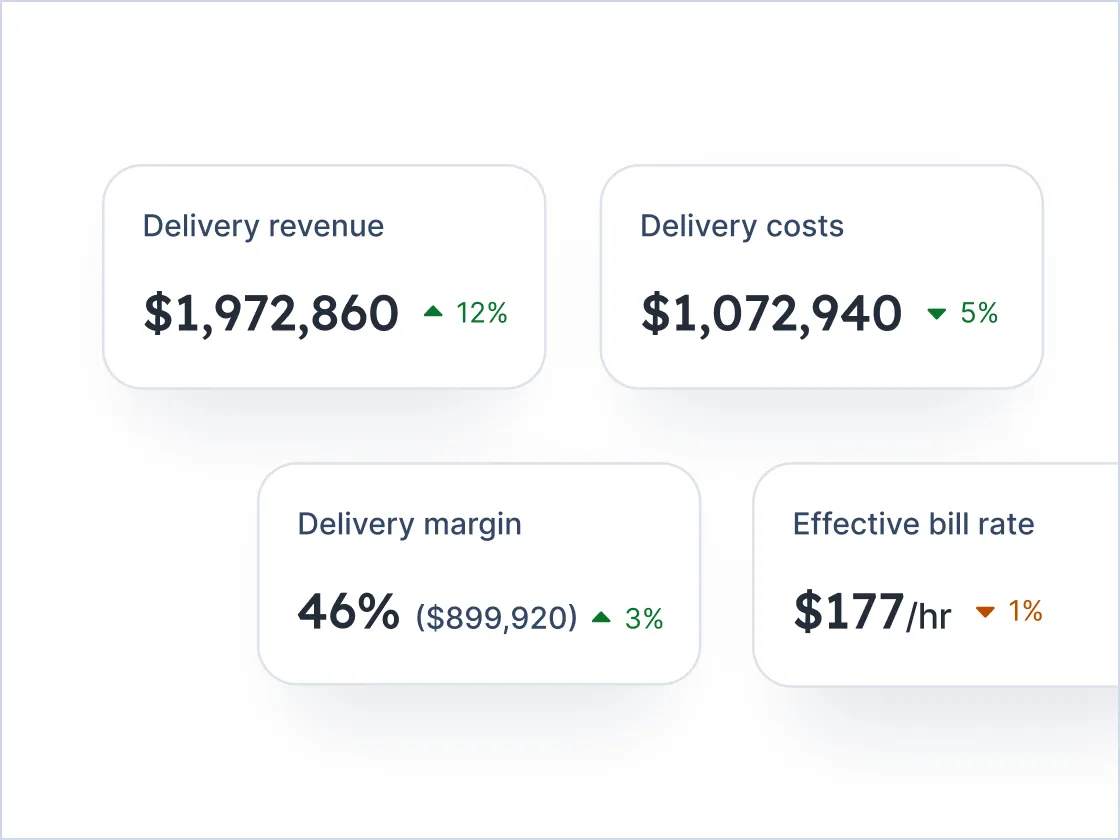
Scope changes, staffing adjustments, and bill rate variations across clients and regions show up in Float as they happen. By the time margin erosion would normally appear in your reporting, your Ops team has already seen it. And you’ve had time to align accordingly.
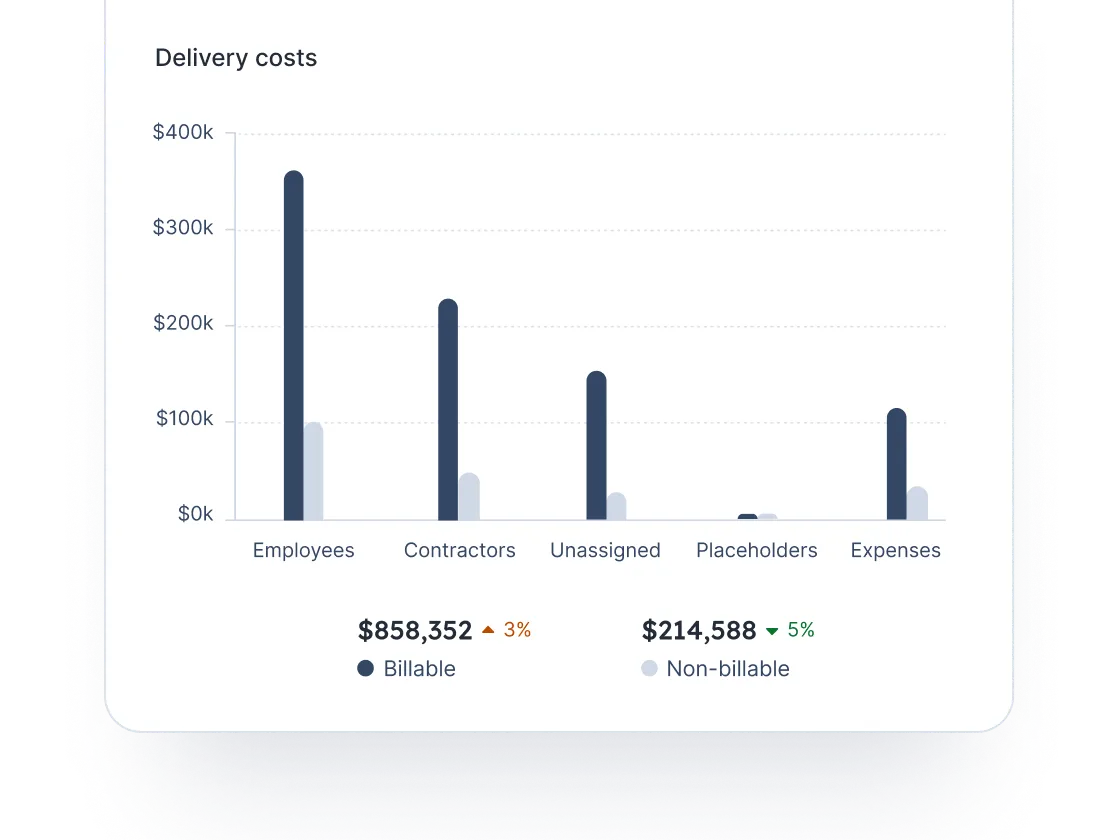
One margin view, across every currency
Float maps your rate cards and billing currencies to each client project, so your home-currency margin view stays current.

Chosen by the best to get resourcing right
See how teams like yours make people-first, profit-minded decisions every day with Float.


Profitable delivery runs on connected data
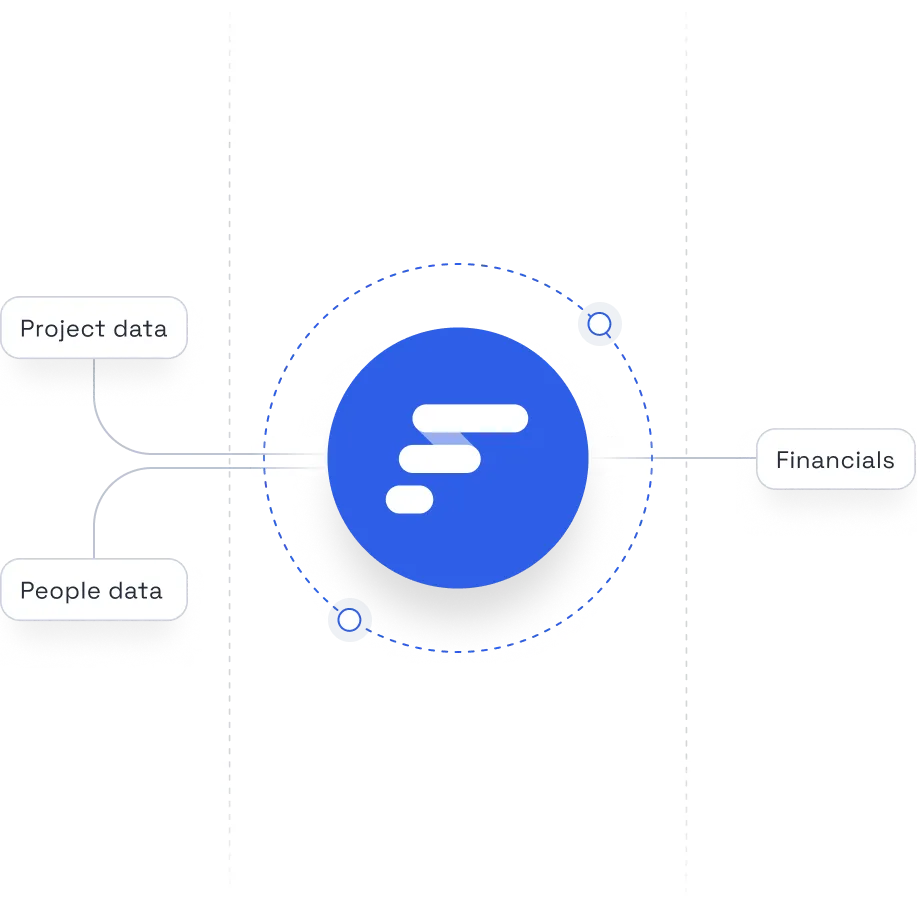
Float sits at the center of your people, project, and financial systems, keeping the data at the core of your operations accurate and always up to date.