
%%Dashboards%% that catch issues early, and %%reports%% that explain them clearly
Get a live view of delivery performance, with the reporting depth to understand what’s driving it.
Bet your reporting only tells you what happened, not what’s happening
Most reports are backward-looking: they land after the decisions are already made. Float keeps you in the picture while there’s still time to act—with dashboards for what’s unfolding and reports for what’s driving it.
Your numbers shouldn’t arrive after the decisions are made

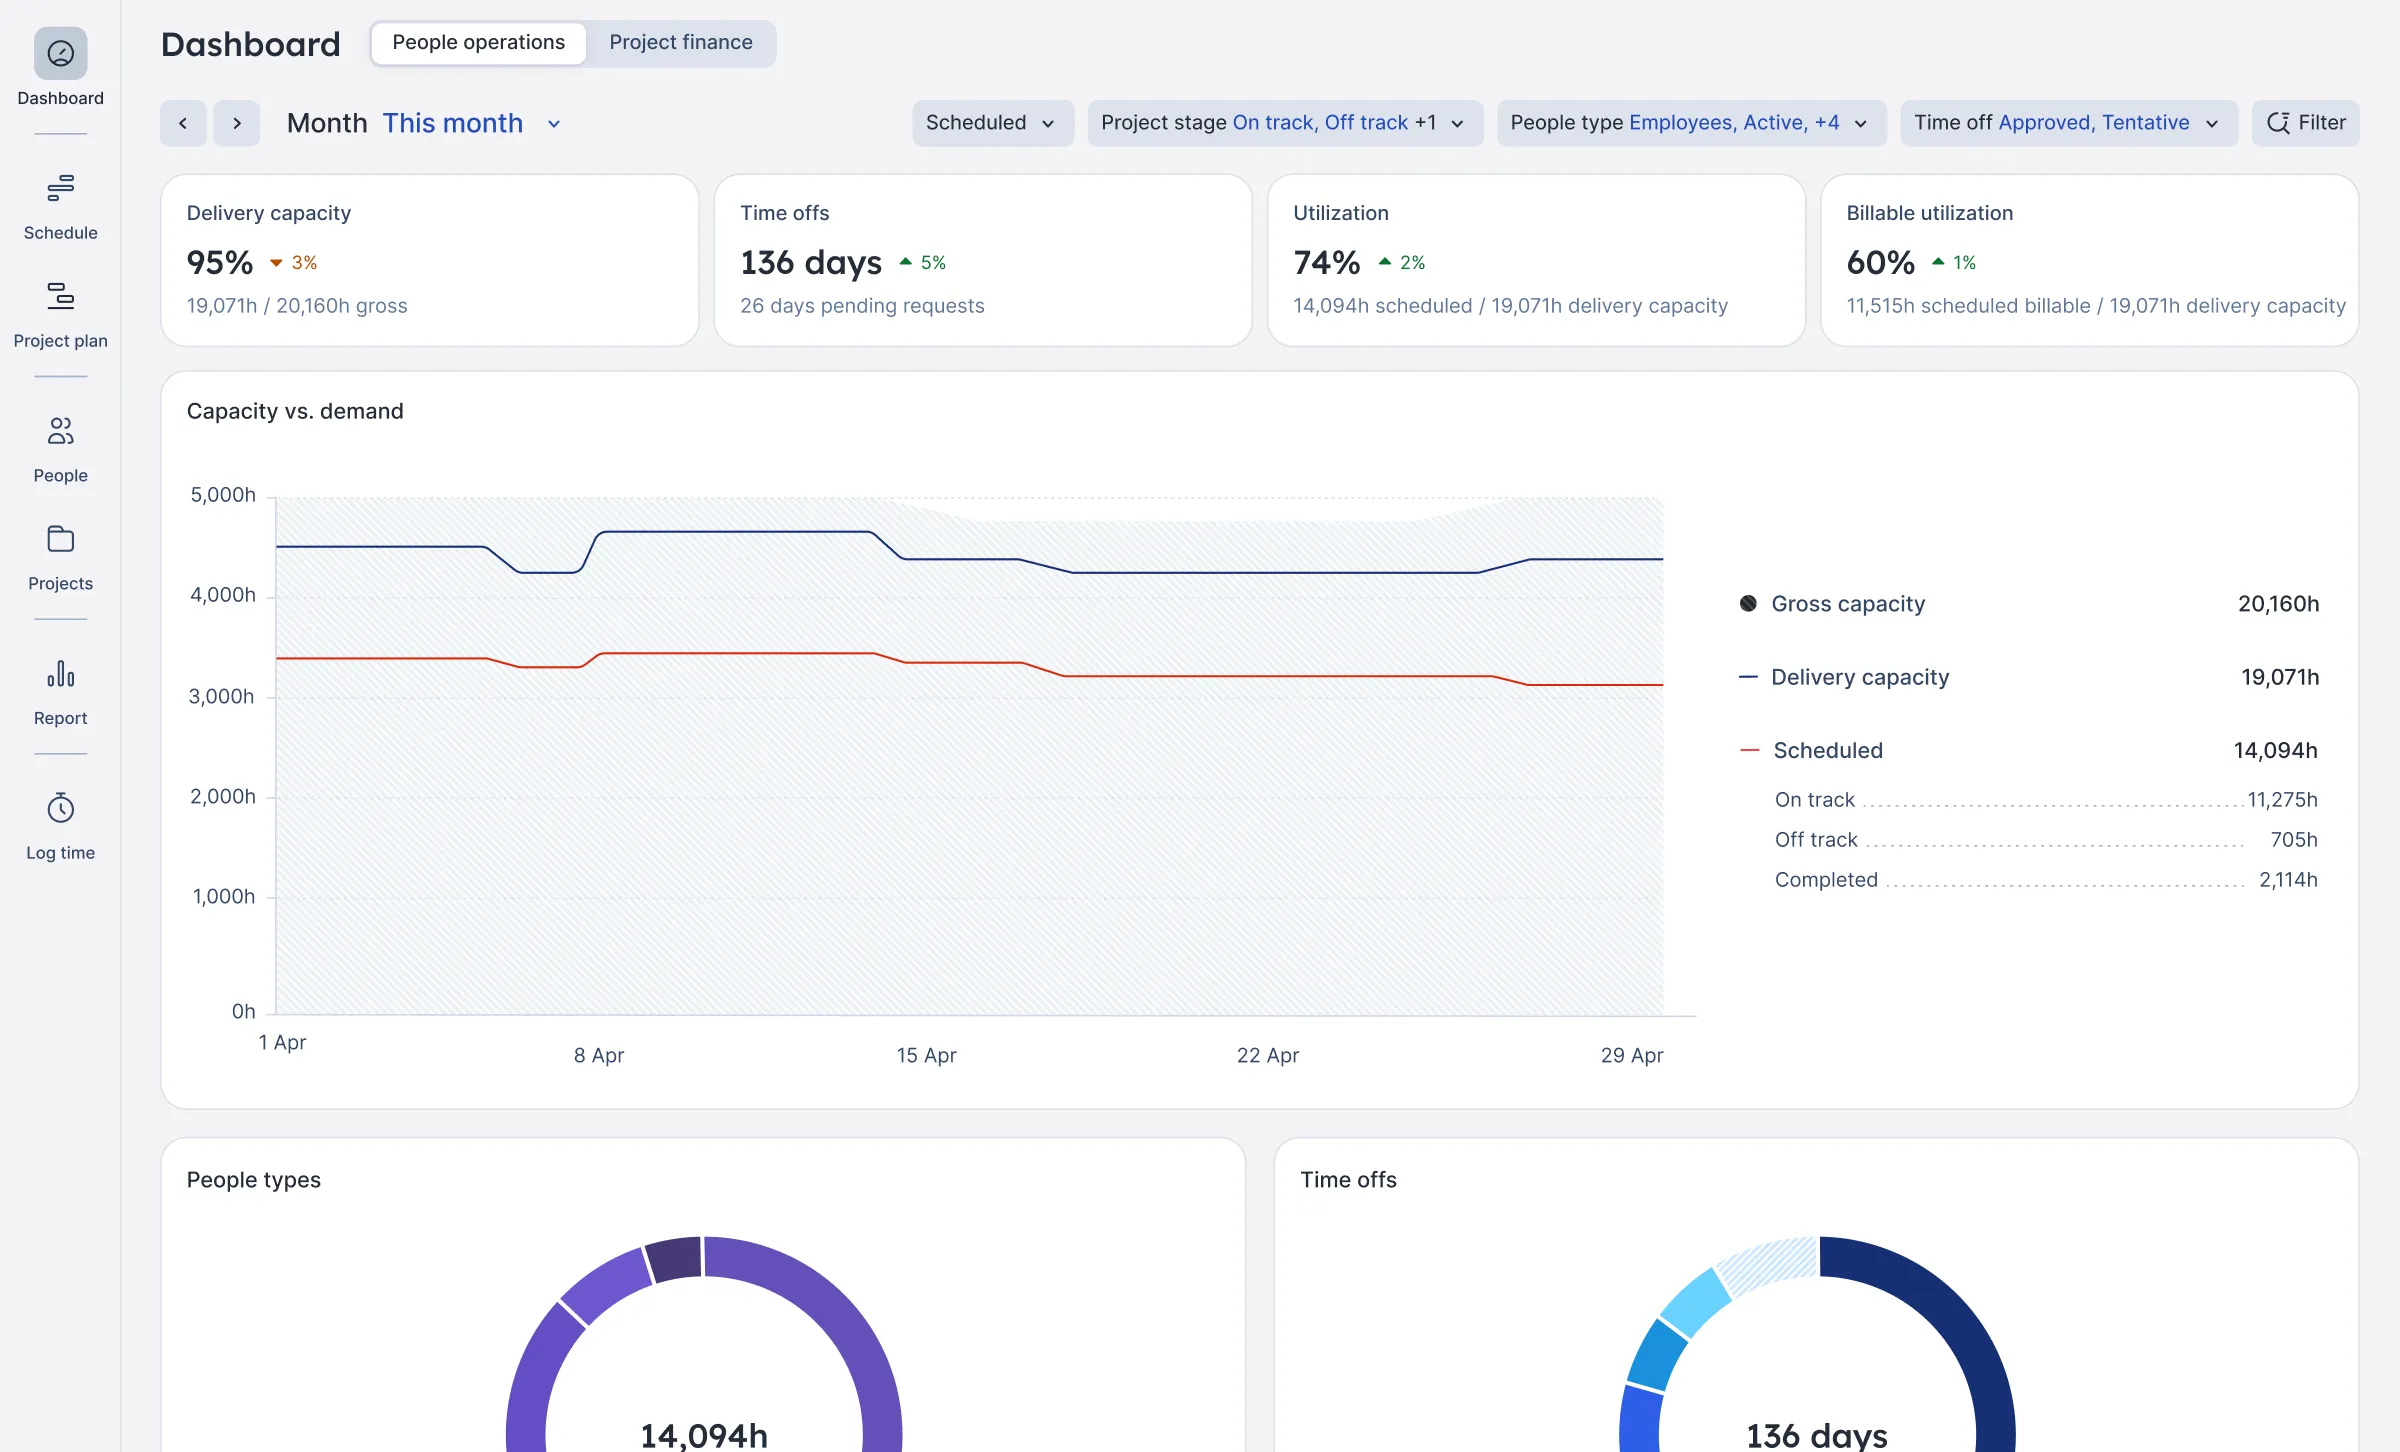
Keep delivery on track
Use real-time insights to keep delivery on track, spot recurring bottlenecks, and balance demand and capacity across teams.

Reduce delivery-driven risk early
Identify margin, revenue concentration, and cost trends across your clients before they hit your bottom line.

Improve utilization
Staff projects with confidence by reviewing real-time utilization trends, estimated vs. planned vs. actual hours, and time off details. All in one place.

Monitor project financials
Know exactly where your projects stand with a real-time view of budget burn, margin, costs, and delivery progress.
Float has made us 50% more efficient… We used the reports from our project to baseline future ones. We’ve done five more of those projects this year, and every single one came in right on budget exactly where we planned it.


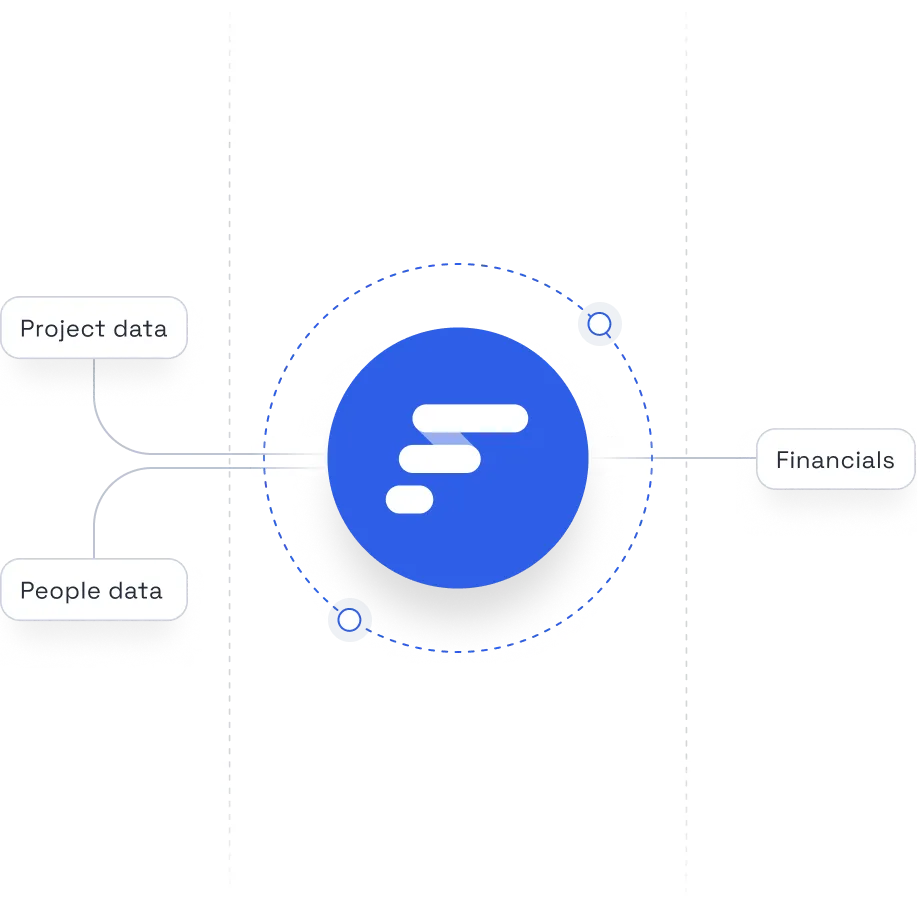
Profitable delivery runs on connected data
Float sits at the center of your people, project, and financial systems, keeping the data at the core of your operations accurate and always up to date.
Frequently asked questions
Float offers real-time reports across utilization, capacity, time, budgets, and margins, plus two live dashboards built specifically for Operations and Finance leaders. The People operations dashboard surfaces capacity and workforce signals early, while the Project finance dashboard tracks margin, revenue, and cost risk as it develops.
Together, reports and dashboards give a clear, trusted view of both delivery and profitability.
Dashboards give you a live view of what’s unfolding (capacity pressure, margin drift, cost trends) so you can act while there’s still time. Reports go deeper: they explain what’s driving it, with the detail Ops and Finance need to understand performance and answer upward.
Most teams use both: dashboards to get a live view of delivery performance overall, and reports to get the depth to understand what’s driving it.
Float tracks project profitability by connecting cost and bill rates to hours resourced against that project. Set budgets and rates upfront, resource work accordingly, then compare scheduled vs. logged time as work happens. That gives Ops and Finance real-time visibility into utilization, cost, and margin.
Plus, the Project finance dashboard surfaces margin, cost, and revenue trends in real time so profitability is managed in the plan instead of being discovered after delivery.
Yes, and it happens automatically. Set a project budget (fixed fee, time & materials, or hours), and Float tracks budget utilization in real time based on the hours your team is scheduled.
For fee-based budgets, you’ll also see cost and margin so you can track profitability, not just hours used. Everything shows up in your project report across estimated, scheduled, and logged hours.
Float supports better utilization by reporting on planned vs. actual work in real time. See where people are over- or under-utilized, spot gaps or overload early, and understand how resourcing decisions affect delivery and margins. The People operations dashboard brings that into a single live view of capacity, workforce mix, and billable utilization, making it a lever Ops can actively manage.
In addition, Float’s reporting turns clean, connected resourcing data into insight today, creating the data foundation needed for AI-driven analysis and recommendations as teams scale.
Unlike isolated spreadsheets, Float keeps your people, plans, time, and financials connected in one live system. Instead of giving you static snapshots, Float’s live dashboards and reports show change as it happens: who’s booked, what’s been logged, and how budgets and margins are tracking. With fewer manual updates and no version chaos, you can make decisions based on current reality instead of hindsight.
Yes. Float integrates with the tools that professional services and in-house teams already use across project management, finance, HR, and calendars. Keep resourcing and time tracking data flowing cleanly into your reports, without manual exports or spreadsheet stitching. Float sits at the center of your stack, giving you a single, reliable view of utilization, budgets, and margins.


