Kanban boards. Scrum boards. Timelines. You may have tried one (or all) of these tools to improve your team management. But, you're looking for something that better matches your project needs and workflow. The answer can be simply: Gantt charts.
Gantt charts are one of the most popular and useful project management tools for planning and scheduling projects.
This guide will walk you through the basics of Gantt charts and how to create effective charts, with tips and examples along the way.
What is a Gantt chart?
A Gantt chart is a bar chart that breaks down projects into timelines, tasks, and delivery dates. Gantt charts help simplify complex projects by breaking them down into phases and milestones. They offer a visualization of projects, including the start dates and tasks to be completed, by who, and by when.
There are different ways to use Gantt charts depending on the project you're managing. Many use it for software development, product launches, construction, and other projects requiring cross-department collaboration. It's an ideal choice for organizing projects of all sizes.
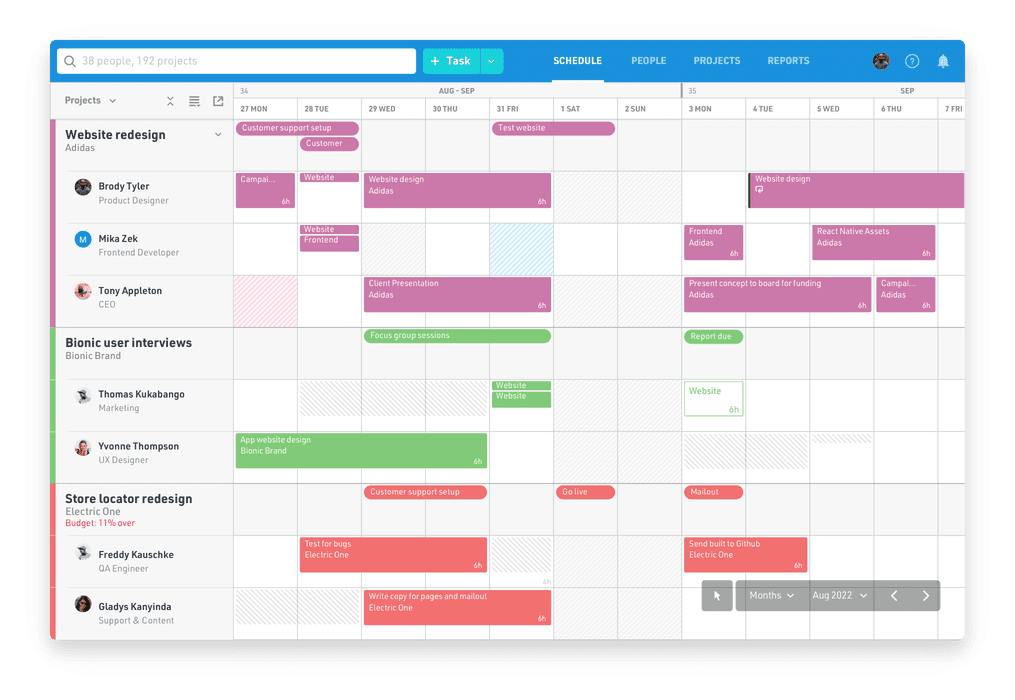
Here's an example of a Gantt chart:
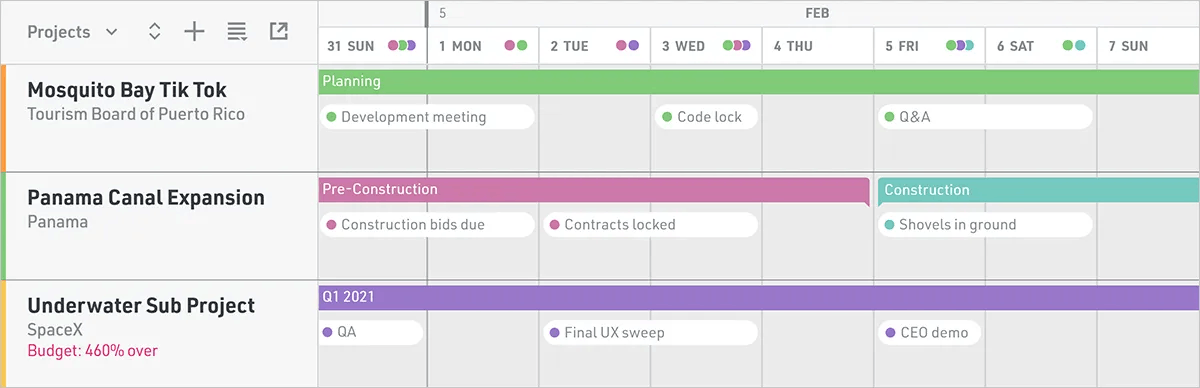
Gantt charts provide a project manager with a high-level overview of their team's workload and deliverables. In the above example, the green, pink, teal, and purple color blocks represent phases of each project. The circles indicate key milestones to be delivered and when they're due. On the left, you'll see that with resource management software you can add a project budget to track spending and that is visible to the team in your shared Gantt chart.
<cta-box><image-color="yellow">
Still using spreadsheets? Try resource management software.
Save time and create accurate project schedules with Float, the #1 rated software for resource management on G2. Get a live view of your team's capacity to plan resources and schedule tasks with confidence.
<cta-button>Try for free</cta-button>
</cta-box>
A brief history of Gantt Charts
The Gantt chart isn't a new project management tool. It’s been around for over 100 years. It was created (or popularized) in the early 1900s by an American mechanical engineer named Henry Gantt.
But word has it that he wasn't the first to use it. It originally appeared in the mid-1890s by a Polish engineer, Karol Adamiecki. Yet, it wasn't widely adopted since it was written in Polish. It wasn't until 1912 when a Swiss civil engineer named Hermann Schurch used Adameicki's concept for his construction projects.
Later, Henry created his own version of the project schedule to simplify tasks in the manufacturing industry.
Today, we've modernized the Gantt chart by implementing the concept into resource management software like Float. It's now possible to streamline project management using automation, resource forecasting, budget tracking, and reporting.
What are Gantt charts used for?
Here's a closer look at how businesses use digital Gantt charts.
Flexible project organization
You took hours developing a project plan. You created the tasks, assigned the team members, and set the deadlines. If everything goes well, the project will take two months to complete. Two months pass, and the project is still trekking along.
Missed deadlines are an ongoing headache for project managers. But let's face it, projects don't always pan out the way you hope. People get sick or fall behind, which creates a dilemma with task dependencies.
This is what makes the Gantt chart helpful. When someone's "out of commission," you can quickly identify dependencies between tasks and reassign duties to prevent further delays.
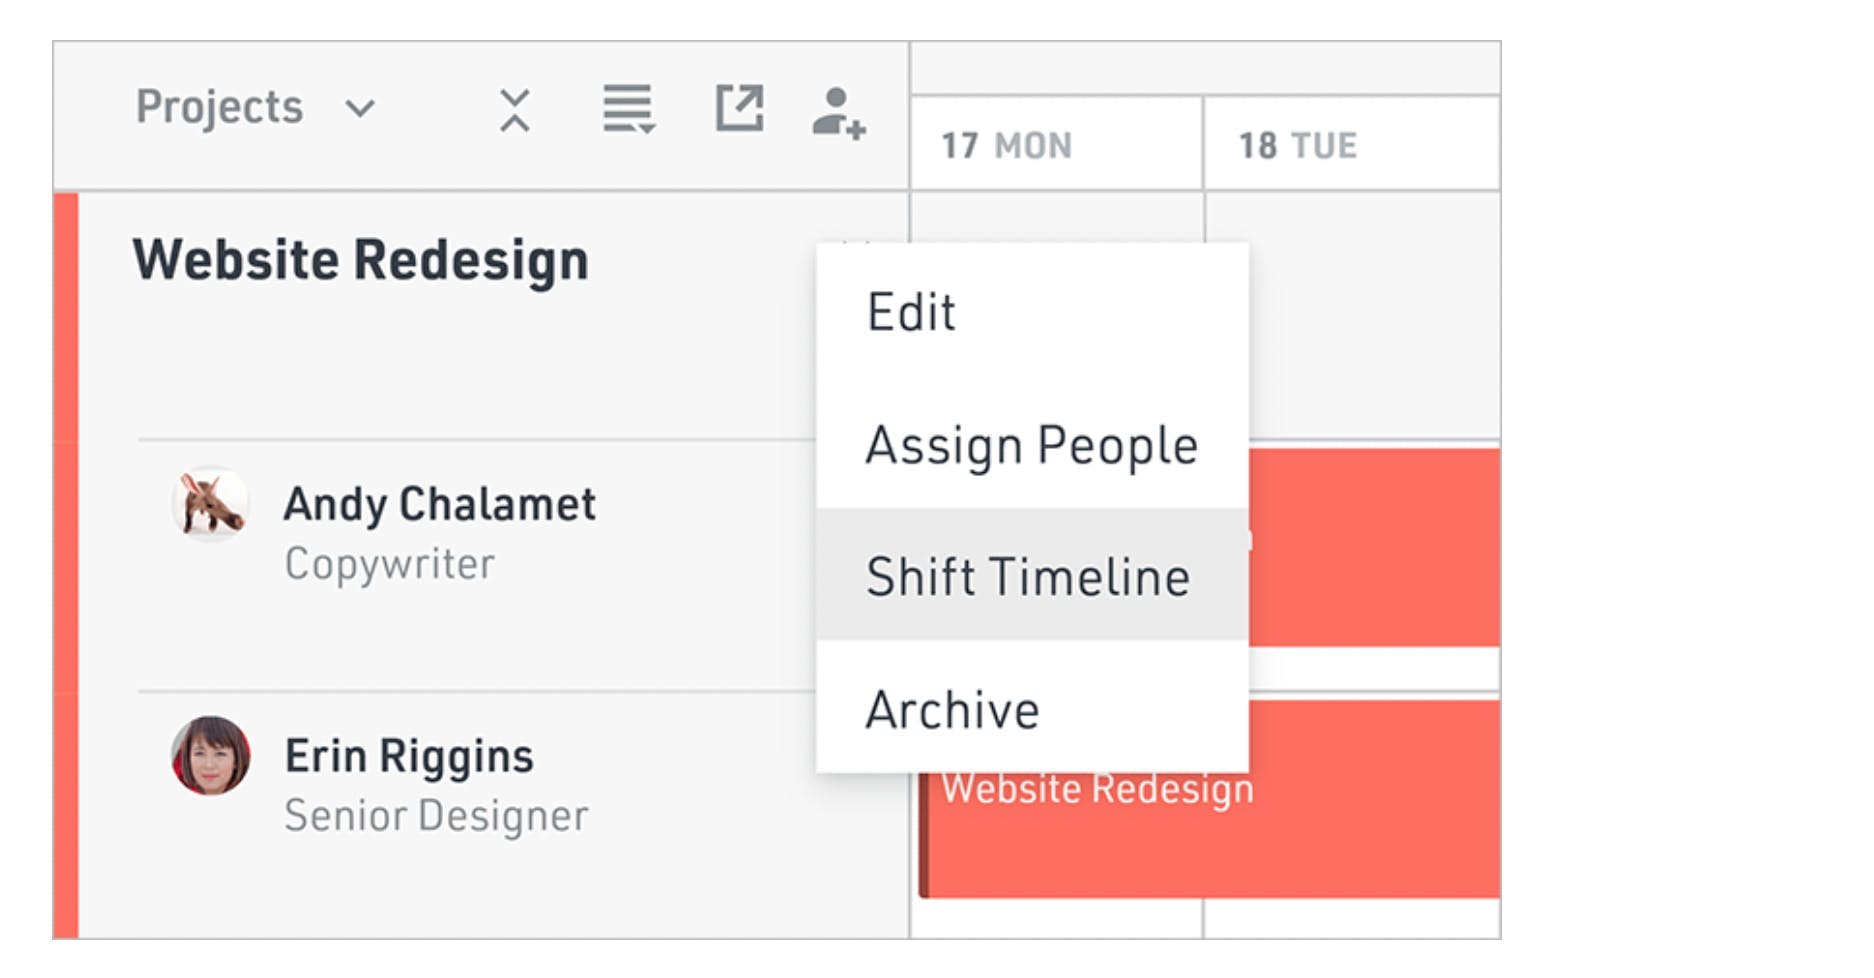
You're also prepared for sudden changes in project scope since you can adjust project milestones and the resources to meet them. With Float, you can move the entire project timeline with a couple of clicks. Just open the project view of the schedule, click shift timeline, and update the start and end dates.
"If your project management isn't flexible, then delays will continue to hurt project timelines." — Martin Dunk, Corporate Services Manager at In Marketing We Trust
Then if there's an unforeseen delay (or an unplanned urgent task), it's simple to move everyone's tasks down by a few days.
"I love how I can drag the phase bar, and all associated bubbles in the schedule shift automatically. It’s a graphic way to shift a timeline," says Jason Ritter, an architect at Rice Fergus Miller.
<tip>
Plan projects phases with resource management software
Float is the #1 rated resource management software on G2 for planning project work. The project phases feature lets you break your projects into smaller, more manageable parts, group and move tasks together whenever a timeline changes, and visualize and track phases alongside your project milestones.
<tip-button>Try for free</tip-button></tip>
Implement and track milestones
Large projects can be intimidating. By adding milestones, it turns a complex project into bite-sized tasks with manageable delivery dates. With software, it's easier to create and track milestones to ensure everything is on schedule throughout the project.
Your team can also view project progress and how close they are to reaching a major goal. In turn, this improves morale, teamwork, and productivity.
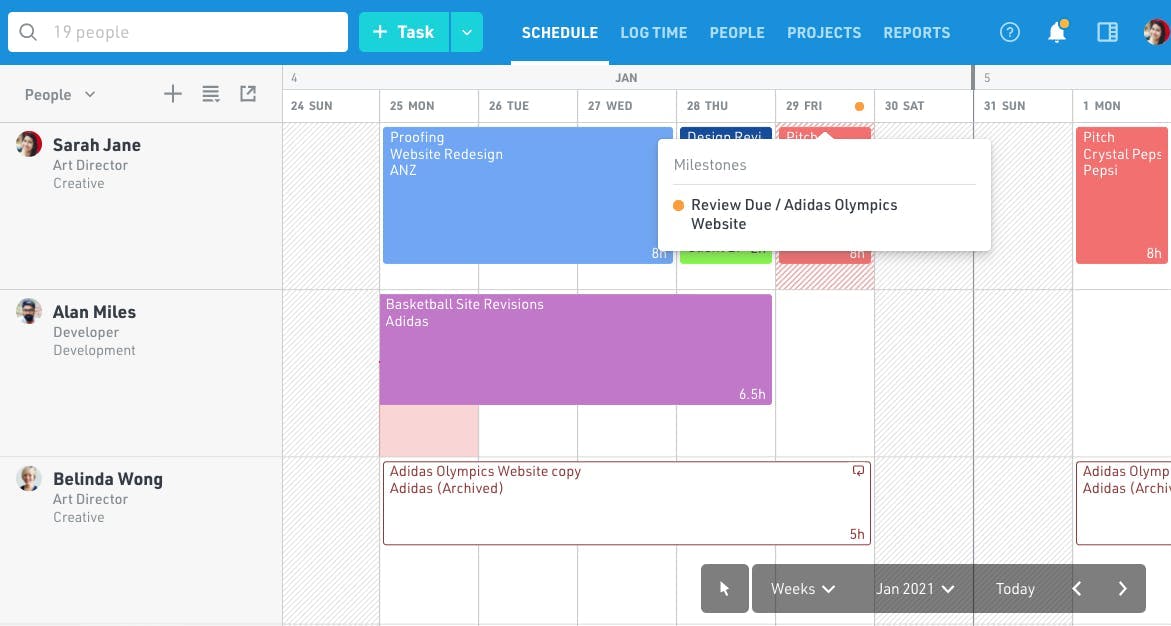
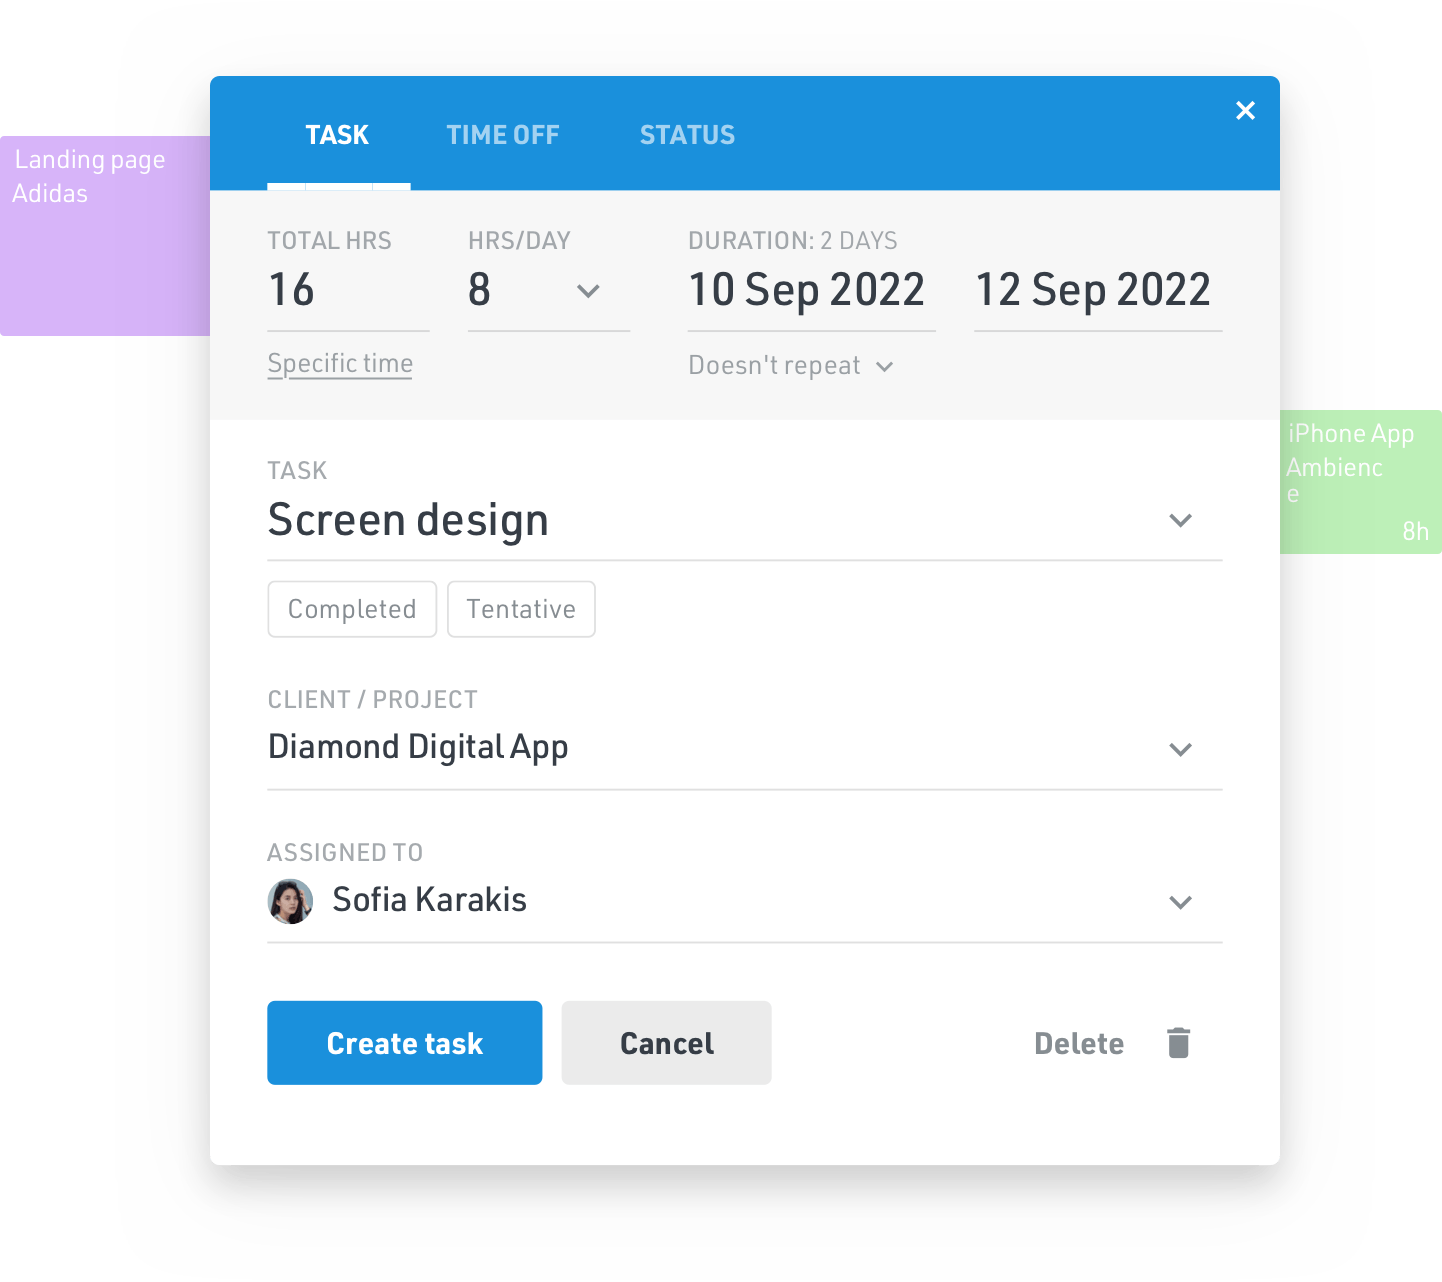
In Float, the milestones are dots (see below) on your calendar. You can hover over them to see details about the project. The horizontal bar lets you know how close you are to completing it.
It's also possible to link tasks within the same project to show how they're all connected. This makes identifying task dependencies easier for both the team, management, and other stakeholders.
In Float, it's as simple as dragging a line to each related task. Just right-click and select "Link" (or "L" on your keyboard). The platform highlights the tasks you can link to and grays the ones you can't. Next, click on the task you want to link, drag a line to the related task, and you're all set!
Just make sure the task you're linking to doesn't begin before the task you selected. You have to link in chronological order.
Set task and deliverable dates
Transparency is what makes good teams great. Visibility provides clear expectations on what they have to do. Using Float's Gantt chart, it's clear to see when a task begins and ends and shows whether a task is dependent on another. This improves accountability and the odds of meeting deadlines.
Then if hiccups occur, such as scope changes, you can easily drag the taskbar to a later date.
➡️ Check out our complete guide to people-first project planning to make the most of this phase and achieve project success.
The benefits of using Gantt charts in project management
Say goodbye to manual spreadsheets and charts. It's time to modernize project management using modern-day Gantt chart software. In doing so, you can improve project management and teamwork.
Here's a look at some of the advantages of the modern Gantt chart:
Offers a high overview of projects
As a project manager, it's your job to keep your team on track and stakeholders at ease. This is challenging to do when you can't see an overview of each project in the works. With a Gantt chart, you have a complete view of a project, including:
- Project phases and milestones
- What tasks are pending and completed
- Who's working on which tasks
- Project budget (estimates vs. actuals)
- Project timeline (will you make the final deadline?)
- Bottlenecks (find and eliminate them)
It takes only seconds to process all of this information since it's presented in a visual format. Then with Float, you can quickly generate a progress report to share with external stakeholders, so they're always in the know.
Improves efficiency and helps manage resources
Ever planned a project and mistakenly assigned too many (or too few) resources to complete it? Or maybe you misallocated resources, and teammates have too much on their plate and fall behind. This happens when you can’t see all of a project's tasks or your team’s bandwidth.
A modern Gantt chart makes this avoidable. For instance, in Float, you can customize team availability and make changes on the fly. This way, you can see who has time to work on tasks before assigning them.
No more uneven workload distribution or burnout.
Keeps teams aligned (especially remote workers)
When is my task due? What should I do next? Who's holding up a task that’s delaying progress?
The transparency digital Gantt charts offer makes team collaboration easier and streamlines project management for remote teams especially. Martin Dunk is the Corporate Services Manager at In Marketing We Trust. Before Float, the team was using Google sheets to plan their time across projects. Since making the switch, Dunk says the team is shocked at how long they went without using a dedicated resource management software!
"When our team was smaller, there was less complexity to managing our workload. We were able to get away with spreadsheets to provide a macro view of our monthly resources. As we've grown, Float has enabled us to scale our operations and be more efficient with our time. We get a high-level view of our team's workload and can also drill down to the finer details required when planning their time," says Dunk.
"With about 10 hours a week spent on resource planning, Float has been a game-changer for us. Since adopting the software, we've added four new clients and been able to do so without any significant additional time spent on the planning side. We have one single source of truth for everyone to know what they're working on and when."
Your team can take accountability for their end of a project and reach out if bottlenecks are holding them back. Combine this with communication tools like Slack, and you have a functional unit for in-house and remote teams.
Make the most of your team's time with the #1 rated resource management software. Try Float free for 14 days.
Motivate team members
Starting a new project places pressure on everyone involved. Seeing all of the tasks pending and looming deadlines can damper moods and motivation. But three things can turn this around:
- Watching the real-time progression of tasks
- Seeing tasks marked off a to-do list
- Reaching a milestone
There's just something about monitoring the progress of your team that drives you forward. Then as you reach near the end of a phase or milestone, it can trigger you to work harder to achieve it.
By adopting modern Gantt charts, you can reduce stress and promote productivity by chopping large projects into smaller milestones, and sharing team progress with everyone in real time.
How to create a Gantt chart
A Gantt chart is simple to make once you have all the needed data. Follow these four steps to begin designing yours:
Step 1: Identify critical tasks
A project landed on your (virtual) desk. It's time to identify all the tasks needed to take it from A to Z. At this stage, it's best to create phases and milestones. Phases are common for projects like construction and product development, which require multiple teams to complete the project.
You can create milestones within those phases, and then build out the tasks needed to complete each milestone and phase. This is where you start building the critical path on your Gantt chart: the longest sequence of tasks needed to complete the project.
How can you tell whether a task is "critical?" Just ask yourself, "If I remove it, will it delay the project?" If so, then include it in your Gantt chart.
Step 2: Identify task relationships
Now for the fun part—using your tool to tie together tasks based on Gantt chart dependency relationships. Group together tasks that rely on one other to complete a larger goal (i.e., milestone or phase).
For example, if you're launching a new product, then you'd group together tasks that fall within the following categories:
- Ideation or concept
- Practical research
- Design and implementation
- Testing
- Product launch
Do this for each project to ensure you don't miss any essential tasks. If you're using Float, you can use the link tasks feature we mentioned earlier.
Step 3: Add activities into your software or template
Now that you know the tasks needed and how they're connected, it's time to add the activities to your chart. You can apply tasks, milestones, and phases to each of your projects.

Then it's time to start assigning tasks to your team. To do this in Float, click anywhere on the schedule to open the task menu.
Make sure to monitor your team's availability to prevent project overload.
Step 4: Continually update your chart
One of the benefits of using Float is it allows agile project management. You can see your team's bandwidth and update their availability on a whim. This allows for quick adjustments in task assignments, project scope, and due dates.
You can also import local public holidays to ensure you don't mistakenly schedule someone on an off day.
It's a good idea to check project schedules weekly or bi-weekly to see if you need to reassign tasks, add resources, or extend deadlines.
Gantt chart examples
Not all Gantt chart tools offer the same capabilities. Sure, you can simplify projects and assign tasks to team members, but they lack vital features like:
- Capacity planning
- Reporting
- Team collaboration
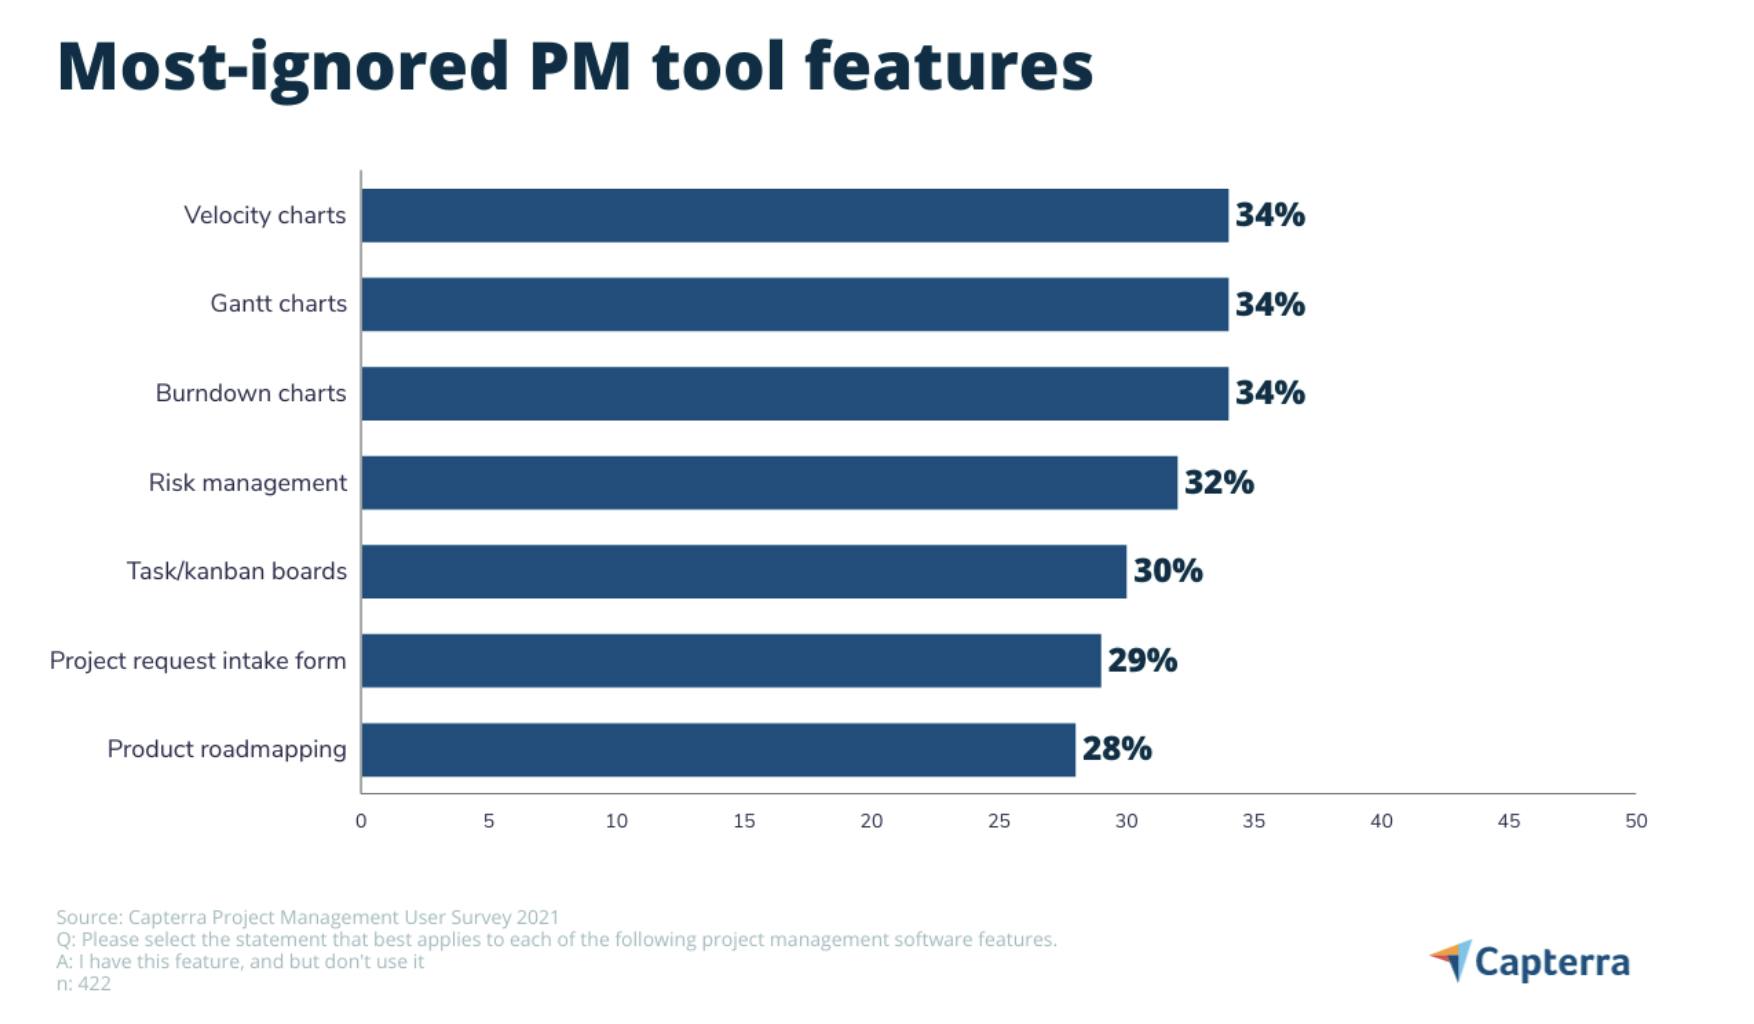
Maybe this is why Gantt charts are the most ignored feature by teams who have access to them.
Here's a look at some of the popularly used Gantt charts today.
Microsoft Excel
The Gantt chart in Excel uses a combination of spreadsheet columns, stacked bar charts, and formulas. You can build your Gantt chart from scratch and change the font and colors.
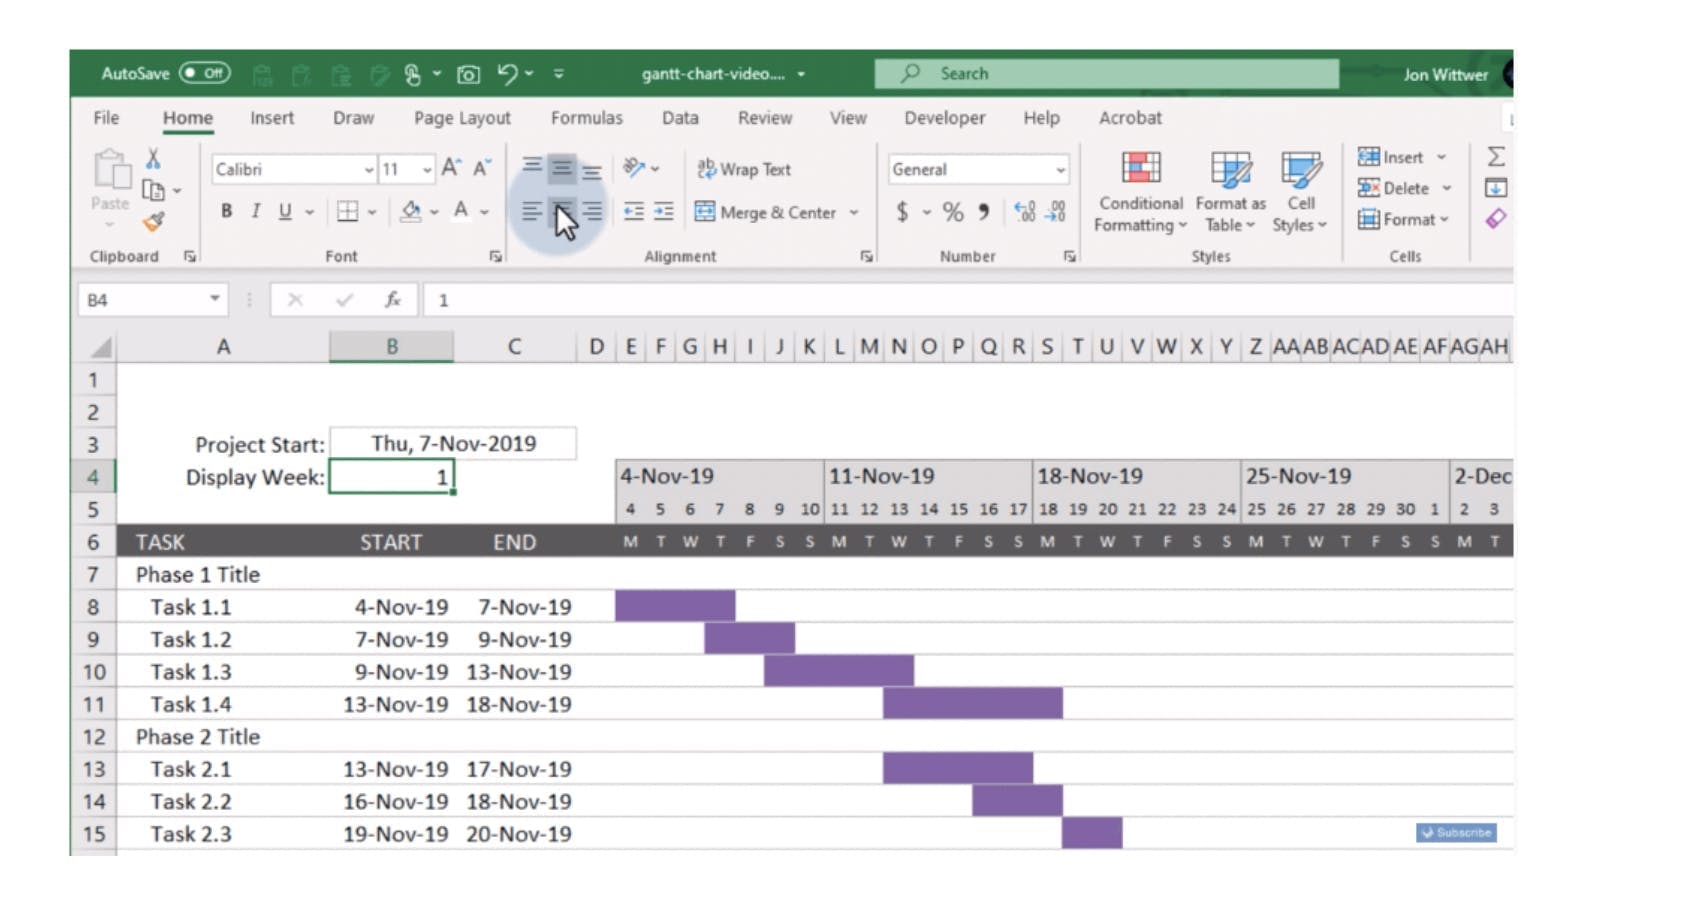
If you own Microsoft Office, then you'll have access to this for free. But it doesn't offer the same security and integrations as other tools.
For example, if you want your team to see the chart during a project, you'll have to grant them access control. This means your team can mistakenly move a deliverable date or delete a task from the timeline.
Plus, Excel doesn't integrate with a lot of project management software used by team leaders. If you’re looking for a tool that automatically updates when a team member finishes a task or a milestone is hit, Excel may not be the right tool for you.
Google Sheets
Google Sheets is ideal if you want a manual Gantt chart that comes with templates. You can preload start/end dates, timelines, and tasks and then modify them for your project needs.
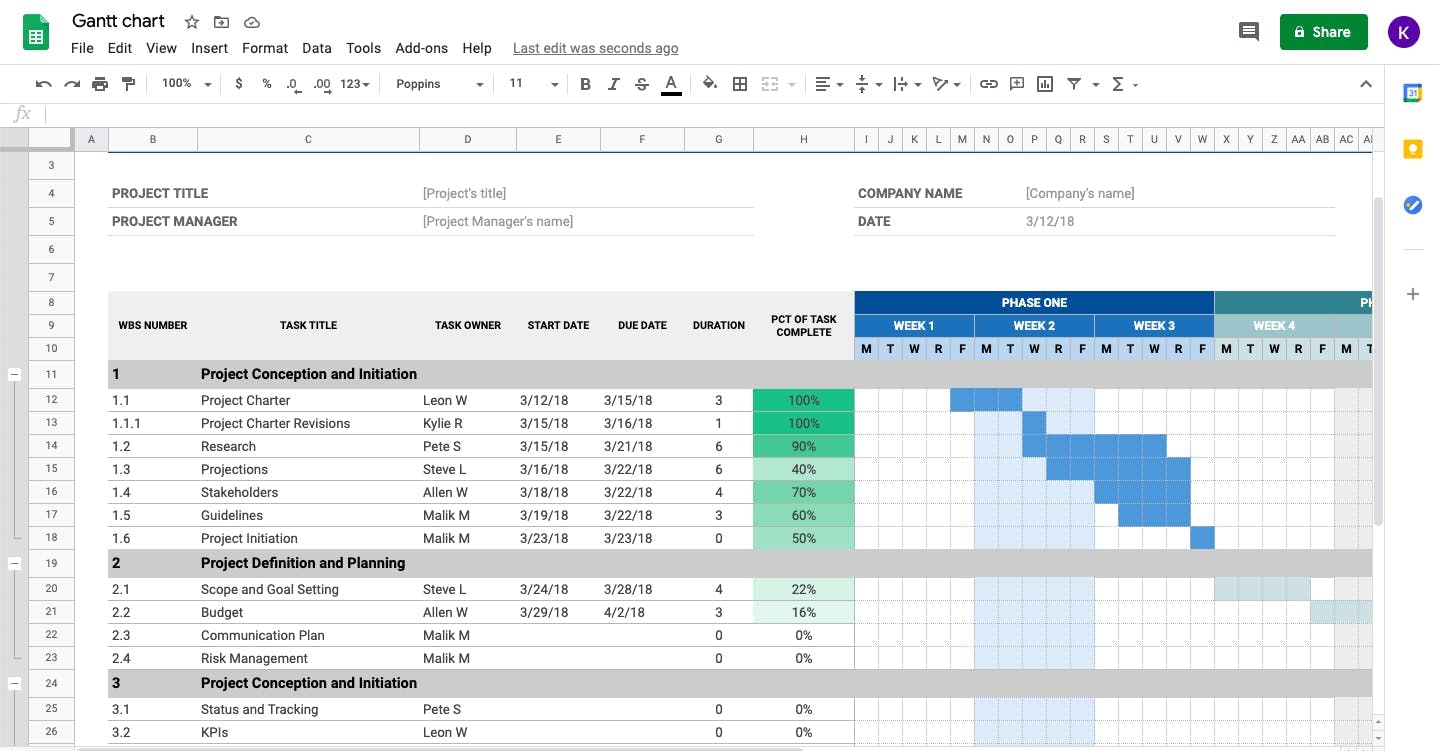
But like with Excel, Google Sheets is manual and doesn't come with automation and collaboration functions needed to make project management seamless.
Float
Float takes proven tools like Gantt charts and merges them with the features today’s project managers really want. This allows easier task management, robust reporting, and greater collaboration.
With Float’s capacity management feature, team leaders can schedule individual work hours and account for holidays and time off to get an accurate picture of their team’s true capacity.
But what if you're already using manual spreadsheets? No problem. Float enables you to import your data and begin using it right away to create new projects and organize teams based on their capacity and skill set.
“It must be clear when your team is free to take on new work, what projects are competing for their attention, and when they have planned time off. These are all factors that influence their capacity and your ability to deliver a new project.” — Glenn Rogers, CEO at Float
MetaLab: A real-world example
MetaLab is a remote-first interface design agency with almost 150 teams members, 34% of which work remotely (across 8 time zones).
Its projects were managed using spreadsheets, which made it challenging to see what everyone was doing. And it took up to three hours a week to keep spreadsheets updated.
Some projects can run anywhere between 8 weeks and 12+ months, and their teams have dynamic schedules and workloads. So they quickly outgrew this process and needed an efficient and flexible tool to manage capacity and resource planning.
By adopting Float, they now have a single source of truth for projects and teams. They also use the tool's tags to identify each member’s time zones for team members, which helps when assigning new projects.
The end result: increased visibility, productivity, and accountability.
Using Gantt chart software
Managing projects using spreadsheets is an option many PMs use by default because they aren't aware of the available software options. For example, in 2020, only 23% of organizations used a PPM or Resource Management software solution. Plus, 54% of project managers didn’t even have access to real-time KPIs.
So we're going to shed some light on Gantt chart software and what it offers.
What is Gantt chart software?
Gantt chart software is a platform project managers use to organize project schedules. You can plan project deadlines, milestones, and phases—and then create tasks and assign them to available team members. Since the software is online, your team has real-time access to the schedule.
The purpose of Gantt chart software is to semi-automate project management, so it's easier to identify team bandwidth, project scope, and budget planning (and tracking). You can also easily share them with team members, clients, and other stakeholders to keep everyone aligned.
Online Gantt chart software vs. desktop apps
There are two types of software available to create Gantt charts—desktop apps and software. The difference between the two is that desktop apps are on your local computer and Gantt chart software is online.
Desktop apps don't offer collaboration between teams. You have to manually create and share the schedule with each team member and stakeholder. There's also the issue with siloes since everyone may use their own project management tool to track tasks.
With software, everyone involved gets instant access and can even make changes (determined by granted permissions you give them).
This makes team collaboration seamless and gives you an instant and up-to-date overview of the project's progress.
Key Gantt chart software features
There are many features you'll find with today's Gantt chart software. Here are the top features you should consider when selecting one:
- Resource scheduling: Assign tasks to available team members at the click of a button.
- Time tracking: Keep track of hours logged to compare estimated and actual hours worked.
- Capacity management: Visualize your team's workload and capacity to prevent under or over-allocating resources.
- Forecasting and reports: No more guessing—see the real-time project progress and team utilization to create accurate project forecasts and reports to share with the team and stakeholders.
- Multi-project planning: Get a high-level view of every project to see competing milestones, manage budgets in real time, and reallocate teams on the fly.
- Dependencies: Identify potential bottlenecks before they occur by identifying delays in tasks with dependencies.
- Drag-and-drop: Quickly move around tasks to set new deadlines and reassign roles in a project (and to link tasks).
- Milestones and phases: Break up projects into phases and milestones to simplify complex projects.
- Integrations: Make collaboration seamless by integrating your favorite tools for communication, productivity, and project management.
Tips to use Gantt charts effectively
Interested in using Gantt charts for your team and project management? Then use the following tips to improve collaboration and communication with your team.
Assign team members to tasks
Don't build your Gantt chart solely around the project and deadlines. Make sure to include which team members you assigned to individual tasks (and dependent tasks). This will provide an overview of which project tasks still need assignment, and how to best approach resource management.
If you're using Float, you can set the hours, duration, and project names for each task, and then assign them to your team. Have a group to assign to a particular task? Float allows you to perform bulk task assignments to speed things along.
Customize your Gantt charts
Templates are available for Gantt charts but you shouldn't simply use them as-is. Customize them so they fit your project and team needs. If you have regular projects with similar requirements, then develop your own templates. This beats building from scratch each time.
In Float, you can customize the colors of your Gantt chart and decide the layout. If you already have a template you like, you can import the data to include fields like:
- Titles and departments for people
- Clients
- Budgets for projects
You can then add and map those fields as needed.
Schedule alerts
If you're using a Gantt chart tool, set up email, mobile push, or Slack schedule alerts for when a task is nearing a deadline, or a milestone is reached.
It's also ideal to create alerts for your team based on their local time zone. This will help ensure your project team doesn't overlook tasks and attends scheduled meetings.
Float integrates with Slack (and other tools), which allows you to send real-time notifications to your team about changes in schedule or other important details.
Set a budget and target milestones
Going over budget and missing deadlines is unacceptable. Yet, it can happen to even the best of project managers. By adopting the right tools, you can avoid this from happening. For example, Float allows you to set budgets and milestones and then track them over time to ensure you don't go overboard.
Get organized using Gantt charts
You need to schedule projects and ensure they're completed on time. Having the best tools and methods is key to making project management faster and easier for everyone. Gantt charts are an excellent method for organizing your teams and tasks, but you need the right tool to streamline project management.
This is where software like Float comes into play. If you're looking to improve team collaboration and productivity, then sign up for a free 14 day trial today.
<cta-box>
<image-color="blue">
Start project planning with the #1 rated resource management software
The world's top teams use Float to plan their projects, manage capacity, and schedule resources. Try it free for 14 days, no credit card required.
<cta-button>Try for free</cta-button>
</cta-box>